


Data analysts turn raw numbers into answers that help people make decisions. The role draws on a handful of core skills, and you can learn them in a sensible order without feeling overwhelmed.
What a data analyst actually does
A typical week involves collecting data from a few sources, cleaning it, finding patterns, and presenting the findings clearly to colleagues who are not data specialists. That mix explains the skill list: tools to handle data, plus the ability to explain what it means.
The roadmap
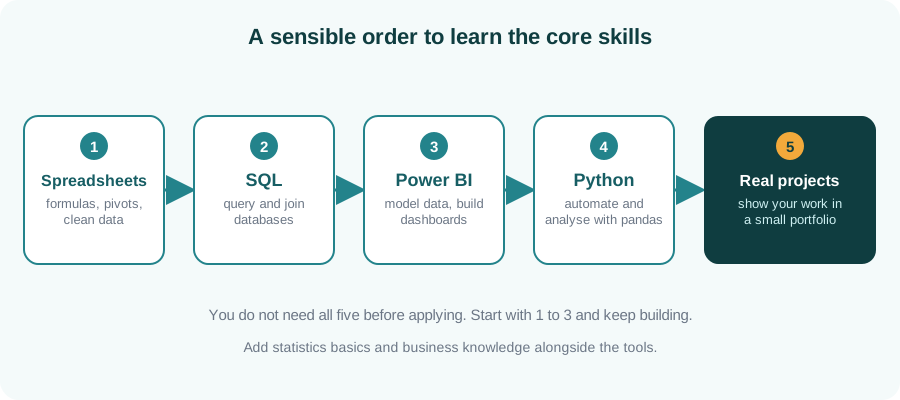
Here is a practical order. Each step builds on the one before it, and each has an obvious small project to prove you can do it.
What each step is for
| Skill | What you use it for | A good first project |
|---|---|---|
| Spreadsheets | Quick analysis, formulas, pivot tables | Clean and summarise a messy sales sheet |
| SQL | Getting data out of databases | Answer five business questions with queries |
| Power BI | Dashboards and shared reports | Build a one-page sales dashboard |
| Python | Automation and deeper analysis | Automate a weekly report from a CSV file |
Skills that are not tools
Show your work
Two or three small projects, each with a short write-up of the question, your method and what you found, are far more convincing than a list of tool names. Use data you are allowed to share, such as public datasets.
Key takeaways
- Start with spreadsheets, then SQL, then a dashboard tool, then Python.
- You can apply for roles once you have the first few skills and a project or two.
- Communication and curiosity matter as much as tools.
- Small, well-explained projects are your best proof.
Build the core skills with a trainer
Explore our SQL, Power BI and Python courses.
Enquire about data courses