



People often ask whether Power BI replaces Excel. It does not. They are built for different jobs, and many teams use both every day. Knowing which to reach for saves time and avoids reports that are hard to maintain.
Where Excel is strongest
Excel is a flexible grid. It is ideal for quick calculations, one-off analysis, small lists, budgets and anywhere you want to type, tweak and see results immediately. Most people already know it, which makes it the natural place to explore a new set of numbers.
Where Power BI is strongest
Power BI is designed for repeatable reporting. It connects to several sources, cleans and combines the data, and publishes interactive dashboards that colleagues can filter themselves. When the data changes, you refresh instead of rebuilding.
Side by side
| Excel | Power BI | |
|---|---|---|
| Best for | Quick analysis, small datasets, ad-hoc work | Dashboards, repeatable reports, larger datasets |
| Sharing | Send or share a file | Publish once; colleagues explore online |
| Updating | Often manual | Refresh from the source |
| Interactivity | Filters and pivot tables | Slicers, drill-down, cross-filtering |
| Learning curve | Familiar to most people | New concepts such as data modelling and DAX |
What a Power BI workflow looks like
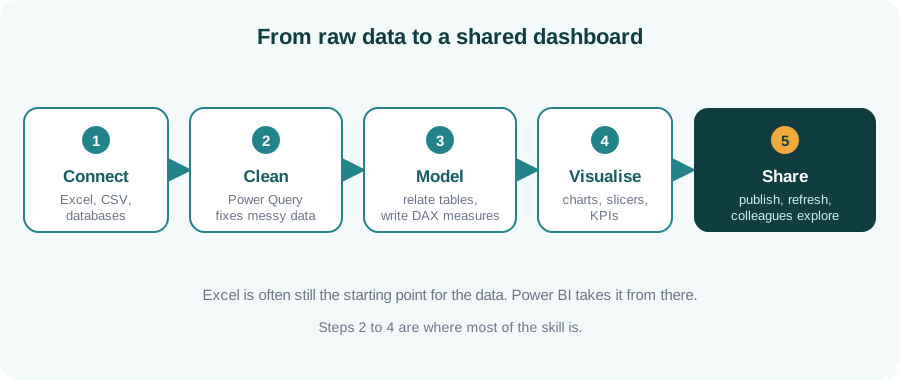
Most of the effort goes into steps two to four: cleaning the data, modelling it and choosing the right visuals. That is also where the real skill lies.
A simple rule of thumb
Key takeaways
- Excel and Power BI complement each other; it is rarely either-or.
- Excel suits quick, flexible, one-off work.
- Power BI suits repeatable, shared, interactive reporting.
- The core Power BI skills are cleaning, modelling and visualising.
Ready to build your first dashboard?
Our Power BI & Data Analytics course covers data cleaning, modelling, DAX and dashboard design.
Enquire about Power BI training